Perfusion Imaging
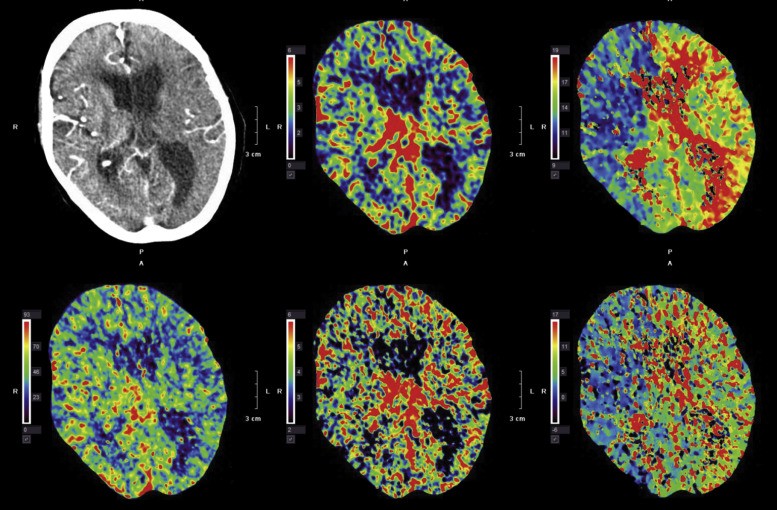
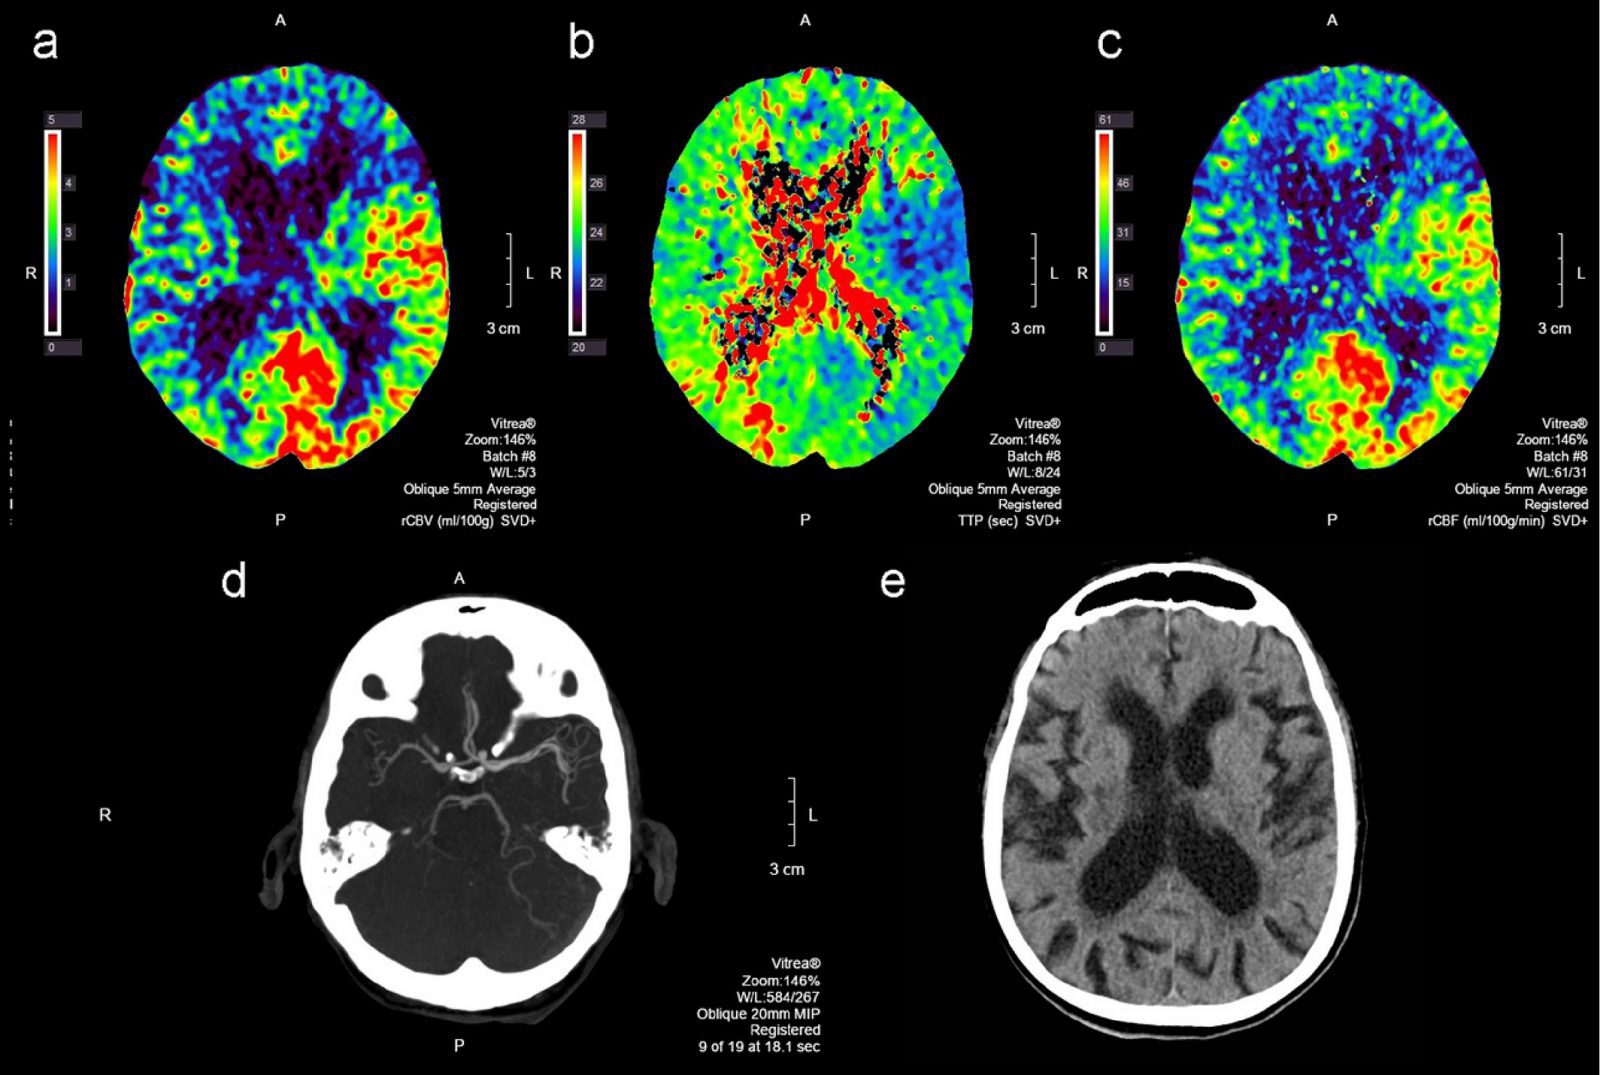
Perfusion Imaging Perfusion is a fundamental biological function that refers to the delivery of oxygen and nutrients to tissue by means of blood flow. Perfusion MRI is sensitive to microvasculature and has been applied in a wide variety of clinical applications, including the classification of tumors, identification of stroke regions, and characterization of other diseases. Perfusion MRI techniques are classified with or without using an exogenous contrast agent. Bolus methods, with injections of a contrast agent, provide better sensitivity with
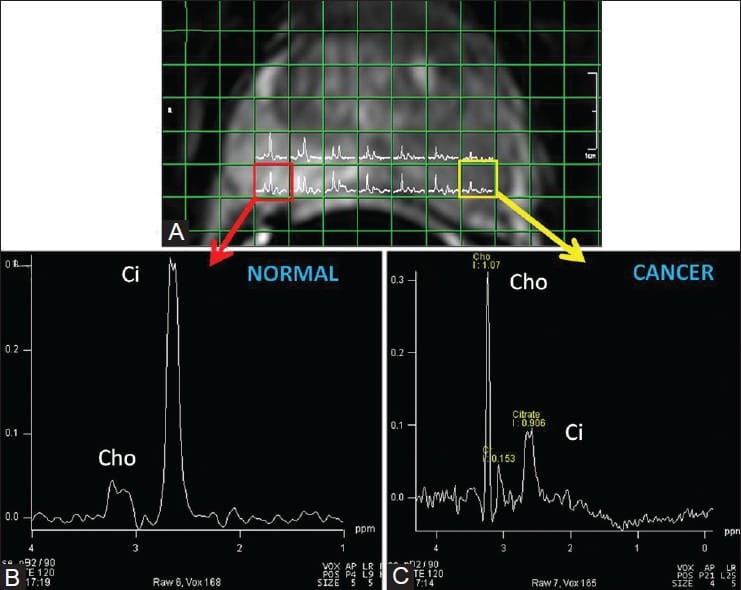
MRS imaging
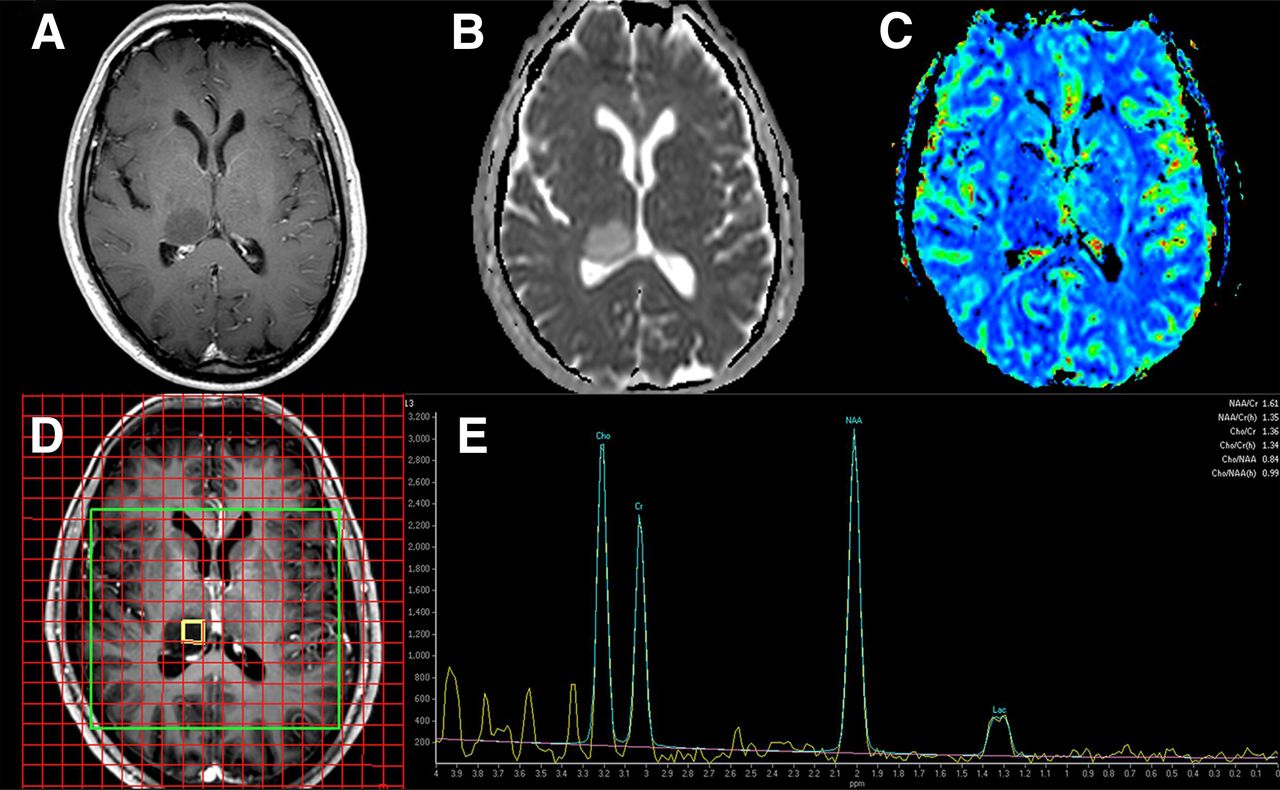
MRS imaging Magnetic Resonance (MR) spectroscopy is a noninvasive diagnostic test for measuring biochemical changes in the brain, especially the presence of tumors. While magnetic resonance imaging (MRI) identifies the anatomical location of a tumor, MR spectroscopy compares the chemical composition of normal brain tissue with abnormal tumor tissue. This test can also be used to detect tissue changes in stroke and epilepsy. MR spectroscopy is conducted on the same machine as conventional MRI. The MRI scan uses a powerful
Functional Magnetic Resonance Imaging (FMRI)
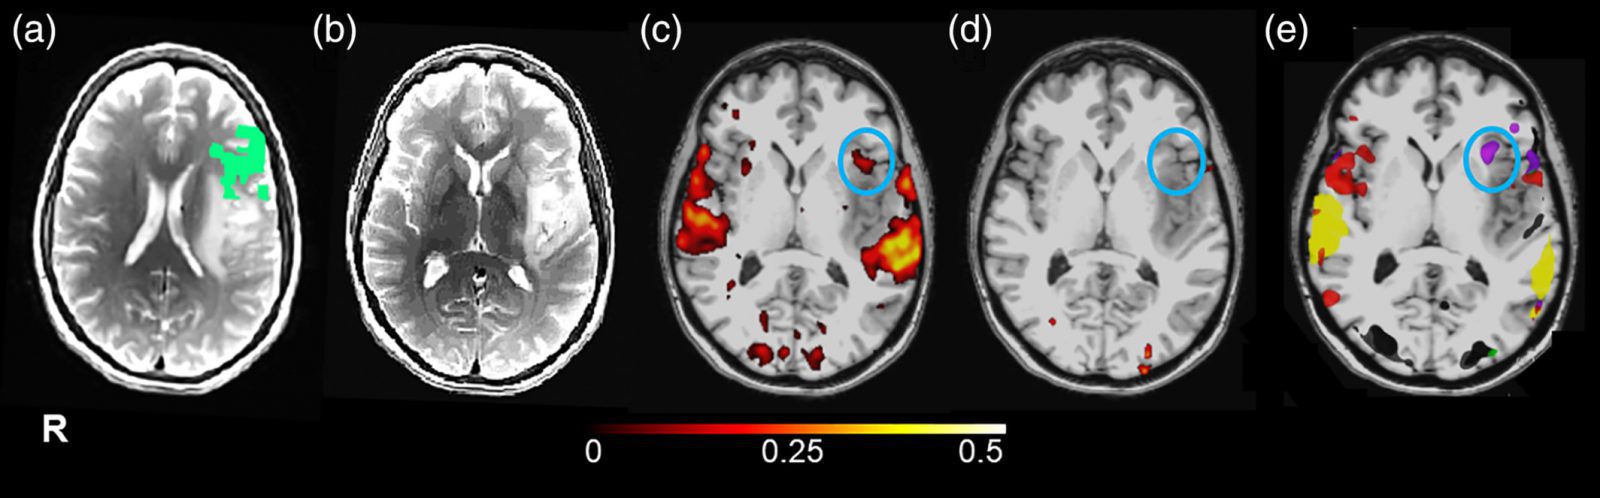
Functional Magnetic Resonance Imaging (fMRI) Functional magnetic resonance imaging (fMRI) measures the small changes in blood flow that occur with brain activity. It may be used to examine the brain’s functional anatomy, (determine which parts of the brain are handling critical functions), evaluate the effects of stroke or other disease, or to guide brain treatment. FMRI may detect abnormalities within the brain that cannot be found with other imaging techniques. FMRI is becoming the diagnostic method of choice for learning
Perfusion Analysis
The calculation of perfusion analysis is based on measurements taken while the bolus travels through the blood system. The starting point is the arterial input function (AIF), measured at the artery before the contrast agent bolus travels through the region of interest (ROI). Perfusion analysis from first-pass contrast enhancement kinetics requires modeling tissue contrast exchange. To streamline the integrated analysis of perfusion parameters, there is a present a visual analysis approach incorporating pre-processing and statistical methods. Motion correction and noise
MRS Analysis
MRS Analysis Equally as important as the pulse sequence used to record the data is the software used for data analysis. Ideally, fully automated spectral curve-fitting algorithms should be used to provide a quantitative estimate of each metabolite concentration. However, although such software exists and is often used in clinical research studies, it is little utilized in routine clinical practice, where visual interpretation (as in most radiological readings) is most common. Other commonly used metrics include ratios of metabolites such
FMRI Analysis
After designing an fMRI paradigm and running the experiment and the data collection, various analysis steps must be applied on resulting data before the neuroscientists and physicians can achieve answers to the questions about activities corresponding to the experiment. The goal of computer-based analysis is to determine automatically, those parts of the brain which respond to stimuli that presented to the subjects. The fMRI analysis methods are composed of several basic stages: Pre-processing, signal detection and description and extraction of